 After a few months of slowing growth rates, European car sales are back with a bang in June: +14,5% to just over 1,4 million units. This is the largest monthly year-over-year increase since December 2009 vs. December 2008. However, this excellent result must be viewed with some skepticism: being the last month of the second quarter and of the first half of 2015, a lot of dealers, importers and even manufacturers have pushed sales to reach their targets. As a result, a lot of the increase in sales can be attributed to pre-registered or self-registered cars, which haven’t yet found an actual buyer. We’ll have to see what happens in the next few months before getting all excited about a real recovery of the European car market.
All the major markets posted double-digit growth in June, with Spain (+23,5%), France (+15%), Italy (+14,4%), Germany and the UK ( both +12,9%) leading the way. Year-to-date, the increase in car sales for the first half of 2015 is a healthy 8%, to 7.371.208 units.
Before we continue, one side note: have you noticed we’ve uploaded historical brand sales figures for Europe as far back as 1990 now? Click on the brand name on this page or use the drop-down select box in the top right-hand corner of this site to check the brand sales and market share all the way from 1990 to 2014. That’s 25 years of verified data, sourced by ACEA, the European Automobile Manufacturers Association. Bear in mind, the EU has added countries over the years, and these sales include all countries within the EU at that point of time. Data from 2006 onwards also includes the countries of the European Free Trade Association EFTA (Norway, Switzerland and Iceland).
 If the Volkswagen Group had a dismal month of May, with declines for its namesake VW brand and its premium Audi brand, and stable sales for Seat and Skoda, in June the manufacturer easily makes up for lost ground, with almost 50.000 additional sales on June 2014. This leaves Renault-Nissan back in second place of biggest winners, just ahead of it French rival PSA Peugeot-Citroën. Honda is the only manufacturer to post lower June sales.
Relatively, the smaller players are making the biggest waves, with Mahindra & Mahindra leading the pack again thanks to its SSangYong SUV brand, at sales up 80,2%. Tesla also has an excellent month at +71,2% and topping 2.000 sales for the second time this year and the first non-March month ever.
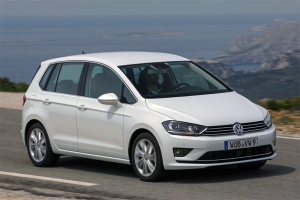
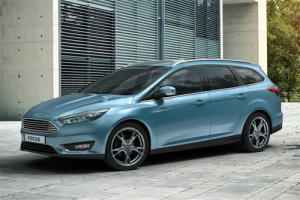 Brands-wise, Volkswagen has a blockbuster month with sales up more than 25.000 units on June 2014, and with over 165.000 its best June ever and its best non-March month since April of 1999. The love is shared by all of its eight brands, as each records a solid increase for the month. Ford also celebrates its return to the biggest winners top-3 for the first time this year, while Audi more than makes up for its loss of 3.889 sales in May by adding almost 11.000 sales in June.
On the loser side, Chevrolet is down “only” 1.783 units because it had already started its decline more than a year ago. But with only 10 brands out of 53 losing sales this month, of which just five lose more than 100 units, not much is needed to hold on to the title it’s held since Daihatsu also left the continent over a year ago.
Honda makes it 5 negative months out of 6 this year, with only the CR-V (just) in positive territory, as does Lancia-Chrysler, which is now for 95,5% dependent on the Ypsilon minicar and for 88,6% on its Italian home market.
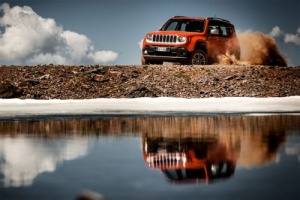 Relatively, Jeep is again the fastest growing brand in Europe with sales up 175% thanks to the Renegade, followed by Lamborghini thanks to the Huracan and Smart thanks to the simultaneous introduction of its new generation Fortwo and Forfour. Great Wall and Tata continue to lose most of their already low sales in select countries.
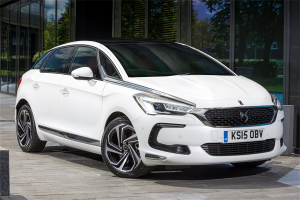 Finally, we congratulate DS with reaching the 500.000 cumulative sales milestone this month. Since its introduction late 2009, over half a million units of the three model DS line-up have been sold in Europe. Two thirds of this volume comes from the subcompact DS3, with the DS4 accounting for just over 100.000 sales and the midsized DS5 adding another 62.000 sales.
June winners and losers
| Manufacturer biggest volume increase | Volkswagen Group | 49.580 | Manufacturer biggest volume lost | Honda | -712 | |
| Renault-Nissan | 17.291 | |||||
| PSA | 16.619 | |||||
| Manufacturer biggest % increase | Mahindra & Mahindra | 80,2% | Manufacturer biggest % lost | Honda | -6,4% | |
| Tesla Motors | 71,2% | |||||
| Mitsubishi Motors | 52,1% | |||||
| Brand biggest volume increase | Volkswagen | 25.226 | Brand biggest volume lost | Chevrolet | -1.783 | |
| Ford | 13.592 | Honda | -712 | |||
| Audi | 10.947 | Lancia-Chrysler | -432 | |||
| Brand biggest % increase | Jeep | 175,8% | Brand biggest % lost | Chevrolet | -92,6% | |
| Lamborghini | 92,0% | Great Wall | -82,2% | |||
| Smart | 89,0% | Tata | -40,0% |
H1 2015 sales
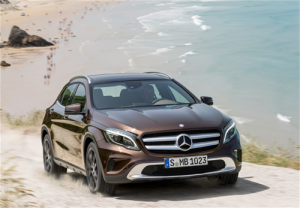 Year-to-date, the excellent month of June helps Volkswagen Group reclaim the title of biggest winner from Renault-Nissan, with Daimler holding on to third place as both of its brands show impressive gains on new model introductions and despite being passed by its rival BMW in the year-to-date ranking. Both brands still gain ground on the luxury-leader Audi.
Only three manufacturers are still in negative territory by the halfway point of the year, with Aston Martin only down 17 sales (1,9%) and GM down only 1,6% as successes at the Opel brand have been able to absorb the losses at Chevrolet, although General Motors is still down 13% on 2013 in a market up 7% since.
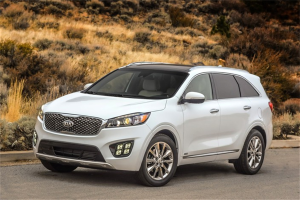 Renault doubles its year-to-date advantage over Opel/Vauxhall for third place, while Nissan consolidates its newfound leadership as the best-selling Asian brand over Toyota. Citroën also passes Toyota YTD, as does Kia with Dacia. These two brands have been swapping places since the beginning of 2015 and it will be interesting to see who comes up on top when December ends. I’ve got my money on Kia as it’s just launched the new Sorento large crossover, but for the rest both brands don’t have any new models planned for the rest of the year.
H1 2015 winners and losers
| Manufacturer biggest volume increase | Volkswagen Group | 125.937 | Manufacturer biggest volume lost | General Motors | -7.883 | |
| Renault-Nissan | 109.841 | Honda | -6.823 | |||
| Daimler AG | 55.567 | Aston Martin | -17 | |||
| Manufacturer biggest % increase | DRB-Hicom (Proton / Lotus) | 55,8% | Manufacturer biggest % lost | Honda | -9,4% | |
| Mahindra & Mahindra | 54,1% | Aston Martin | -1,9% | |||
| Mitsubishi Motors | 51,8% | General Motors | -1,6% | |||
| Brand biggest volume increase | Volkswagen | 69.942 | Brand biggest volume lost | Chevrolet | -32.862 | |
| Nissan | 51.648 | DS | -8.783 | |||
| Renault | 48.215 | Honda | -6.823 | |||
| Brand biggest % increase | Jeep | 180,3% | Brand biggest % lost | Chevrolet | -96,4% | |
| Lamborghini | 112,8% | Great Wall | -78,3% | |||
| Mahindra | 69,8% | Tata | -50,8% |
June 2015 brand ranking
| Brand | June 2015 | June 2014 | change | |
| 1 | Volkswagen | 165.612 | 140.386 | 18,0% |
| 2 | Renault | 110.458 | 105.077 | 5,1% |
| 3 | Ford | 104.704 | 91.112 | 14,9% |
| 4 | Opel/Vauxhall | 101.034 | 92.500 | 9,2% |
| 5 | Peugeot | 84.391 | 74.786 | 12,8% |
| 6 | Audi | 75.111 | 64.164 | 17,1% |
| 7 | BMW | 71.503 | 64.298 | 11,2% |
| 8 | Mercedes-Benz | 69.663 | 59.932 | 16,2% |
| 9 | Fiat | 65.316 | 57.087 | 14,4% |
| 10 | Skoda | 60.301 | 52.023 | 15,9% |
| 11 | Citroën | 58.400 | 51.252 | 13,9% |
| 12 | Nissan | 52.851 | 43.188 | 22,4% |
| 13 | Toyota | 51.366 | 46.453 | 10,6% |
| 14 | Hyundai | 41.891 | 38.762 | 8,1% |
| 15 | Dacia | 39.439 | 37.417 | 5,4% |
| 16 | Kia | 37.756 | 32.406 | 16,5% |
| 17 | Seat | 34.978 | 31.294 | 11,8% |
| 18 | Volvo | 26.663 | 21.887 | 21,8% |
| 19 | Mini | 20.064 | 15.215 | 31,9% |
| 20 | Mazda | 18.752 | 15.218 | 23,2% |
| 21 | Suzuki | 15.497 | 13.629 | 13,7% |
| 22 | Land Rover | 13.376 | 9.213 | 45,2% |
| 23 | Mitsubishi | 12.826 | 8.434 | 52,1% |
| 24 | Honda | 10.345 | 11.057 | -6,4% |
| 25 | Smart | 9.128 | 4.829 | 89,0% |
| 26 | DS | 8.352 | 8.486 | -1,6% |
| 27 | Jeep | 8.336 | 3.022 | 175,8% |
| 28 | Porsche | 6.407 | 5.040 | 27,1% |
| 29 | Lancia-Chrysler | 6.398 | 6.830 | -6,3% |
| 30 | Alfa Romeo | 5.497 | 5.770 | -4,7% |
| 31 | Jaguar | 3.837 | 2.839 | 35,2% |
| 32 | Lexus | 3.231 | 2.432 | 32,9% |
| 33 | Subaru | 3.046 | 2.783 | 9,5% |
| 34 | Tesla | 2.047 | 1.196 | 71,2% |
| 35 | SSangYong | 1.389 | 765 | 81,6% |
| 36 | Maserati | 644 | 571 | 12,8% |
| 37 | Infiniti | 527 | 302 | 74,5% |
| 38 | Ferrari | 276 | 264 | 4,5% |
| 39 | Bentley | 254 | 218 | 16,5% |
| 40 | SAIC MG | 234 | 196 | 19,4% |
| 41 | Aston Martin | 165 | 160 | 3,1% |
| 42 | Lada | 162 | 130 | 24,6% |
| 43 | Chevrolet | 142 | 1.925 | -92,6% |
| 44 | Lotus | 104 | 75 | 38,7% |
| 45 | Lamborghini | 96 | 50 | 92,0% |
| 46 | Dodge | 55 | 67 | -17,9% |
| 47 | Rolls Royce | 54 | 64 | -15,6% |
| 48 | Mahindra | 51 | 34 | 50,0% |
| 49 | Cadillac | 41 | 32 | 28,1% |
| 50 | Tata | 18 | 30 | -40,0% |
| 51 | DR | 16 | 20 | -20,0% |
| 52 | Great Wall | 5 | 29 | -82,8% |
| 53 | Daihatsu | 1 | 0 | – |
H1 2015 brand ranking
| Brand | H1 2015 | H1 2014 | change | |
| 1 | Volkswagen | 895.506 | 825.564 | 8,5% |
| 2 | Ford | 546.340 | 514.221 | 6,2% |
| 3 | Renault | 514.724 | 466.509 | 10,3% |
| 4 | Opel/Vauxhall | 495.195 | 469.794 | 5,4% |
| 5 | Peugeot | 446.602 | 420.935 | 6,1% |
| 6 | Audi | 398.890 | 384.380 | 3,8% |
| 7 | BMW | 370.775 | 345.112 | 7,4% |
| 8 | Mercedes-Benz | 370.354 | 333.754 | 11,0% |
| 9 | Fiat | 351.896 | 322.244 | 9,2% |
| 10 | Skoda | 316.267 | 298.331 | 6,0% |
| 11 | Nissan | 301.323 | 249.675 | 20,7% |
| 12 | Citroën | 291.894 | 283.602 | 2,9% |
| 13 | Toyota | 290.188 | 280.272 | 3,5% |
| 14 | Hyundai | 235.145 | 216.458 | 8,6% |
| 15 | Dacia | 202.475 | 193.549 | 4,6% |
| 16 | Kia | 201.766 | 184.862 | 9,1% |
| 17 | Seat | 184.504 | 169.966 | 8,6% |
| 18 | Volvo | 134.686 | 124.264 | 8,4% |
| 19 | Mazda | 99.286 | 92.072 | 7,8% |
| 20 | Mini | 94.642 | 70.473 | 34,3% |
| 21 | Suzuki | 89.460 | 86.411 | 3,5% |
| 22 | Land Rover | 77.062 | 65.720 | 17,3% |
| 23 | Mitsubishi | 69.777 | 45.966 | 51,8% |
| 24 | Honda | 65.522 | 72.345 | -9,4% |
| 25 | Smart | 50.646 | 31.678 | 59,9% |
| 26 | Jeep | 44.292 | 15.799 | 180,3% |
| 27 | DS | 40.423 | 49.206 | -17,8% |
| 28 | Porsche | 36.609 | 27.761 | 31,9% |
| 29 | Lancia-Chrysler | 35.994 | 40.703 | -11,6% |
| 30 | Alfa Romeo | 31.016 | 32.689 | -5,1% |
| 31 | Lexus | 19.062 | 14.240 | 33,9% |
| 32 | Subaru | 18.820 | 18.380 | 2,4% |
| 33 | Jaguar | 15.842 | 15.897 | -0,3% |
| 34 | Tesla | 7.038 | 5.440 | 29,4% |
| 35 | SSangYong | 6.120 | 3.990 | 53,4% |
| 36 | Maserati | 3.410 | 3.113 | 9,5% |
| 37 | Infiniti | 2.835 | 1.783 | 59,0% |
| 38 | SAIC MG | 1.672 | 1.204 | 38,9% |
| 39 | Ferrari | 1.549 | 1.489 | 4,0% |
| 40 | Bentley | 1.261 | 1.351 | -6,7% |
| 41 | Chevrolet | 1.222 | 34.084 | -96,4% |
| 42 | Lada | 965 | 731 | 32,0% |
| 43 | Aston Martin | 887 | 904 | -1,9% |
| 44 | Lamborghini | 498 | 234 | 112,8% |
| 45 | Lotus | 455 | 291 | 56,4% |
| 46 | Rolls Royce | 317 | 374 | -15,2% |
| 47 | Mahindra | 292 | 172 | 69,8% |
| 48 | Dodge | 251 | 349 | -28,1% |
| 49 | Cadillac | 235 | 203 | 15,8% |
| 50 | DR | 148 | 120 | 23,3% |
| 51 | Tata | 124 | 252 | -50,8% |
| 52 | Great Wall | 48 | 221 | -78,3% |
| 53 | Daihatsu | 8 | 7 | 14,3% |
| 54 | Bugatti | 3 | 5 | -40,0% |