
 Growth of passenger car sales in Europe has stalled in May 2015, with just a 1,3% increase over the same month last year, at 1,142 million cars sold. As a result, the year-to-date improvement has shrunk to 6,53% at almost 6 million sales. Is this month a temporary glitch in the 22 month-long recovery or does it signal an underlying weakness in the European car market? We’ll have to see next month. Spain and Italy showed strong gains of 14% and 10,8% respectively, and the UK continued its impressive performance at +2,4%. However, French car sales were down 3,5% and in Germany 6,7% fewer cars were sold in May. Year-to-date figures for these five largest markets are still positive, though.
Renault-Nissan benefit the most again, adding just under 10.000 sales, while both premium manufacturers Daimler AG and BMW Group followed suit at almost 7.500 and 5.900 extra sales respectively. Surprisingly, after being among the biggest contributors to Europe’s recovery, Volkswagen Group is suddenly among the biggest losers, with a minus of just over 5.000 units, a figure only “beaten” by PSA at -7.000 sales. As becoming usual, General Motors is in the negative top-3 at -4.500 units.
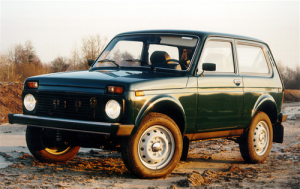 Relatively, AvtoVAZ from Russia is the fastest growing manufacturer at +59,2% thanks to the return of Lada in a few European countries. Mahindra & Mahindra, owner of SsangYong, follows suit with +52,9% and Mitsubishi completes the top 3 at +30,6%. Honda keeps losing customers due to its failure to bring attractive new products to Europe quickly enough, and is down 17,1% in May, not far ahead of DRB-Hicom, whose Lotus brand of sports cars has an off-month at -16,7% after showing impressive gains earlier this year. Also surprising to see a large manufacturer like Toyota drop more than 9%.
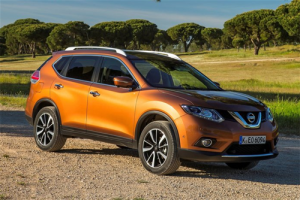 Brands-wise, Nissan is the biggest winner in May, while Toyota is the biggest loser. As a result, while Nissan trailed its Japanese rival by 7.000 units last May, it is ahead by 2.500 sales this year, and increasing its lead year-to-date. Nissan is helped by successes of the X-Trail and Juke and the introduction of the Pulsar, which offset losses of the Note and Micra. Toyota on the other hand is held back by losses of its bestsellers the Auris and Yaris, which the new generation Aygo couldn’t make up for.
Jeep and Mini also add more than 4.000 sales to their May score thanks to the Renegade and the third generation Mini hatchback and the new 5-door, while Audi is a surprising loser as the A3 is losing steam and the A4 is about to be replaced. DS is also still in negative territory, as the facelifted DS3 hasn’t picked up steam yet and the brand is in a new-product drought.
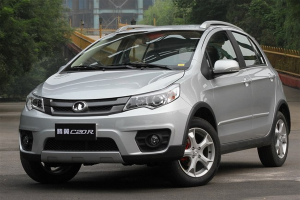 Lamborghini is the fastest growing brand relatively, with sales increasing 142,9% thanks to the all-new Huracan, followed by Jeep (+139,5%) and Mahindra (+107,7%), also more than doubling up. The fastest shrinking brands, behind obviously Chevrolet, are the small players that are available in just a handful of countries: Great Wall and Tata. Great wall is down 78,9% to just 8 sales in Europe, vs. 54 sales in Bulgaria, -27%, and 6.289 sales in China, -42%, as the company switches its focus to the hot SUV and crossover market with its Haval brand. Tata is down 57,1% to just 18 sales as the brand still hasn’t made its official return to select European markets.
May winners and losers
| Manufacturer biggest volume increase | Renault-Nissan | 9.873 | Manufacturer biggest volume lost | PSA | -6.994 | |
| Daimler AG | 7.439 | Volkswagen Group | -5.073 | |||
| BMW AG | 5.889 | General Motors | -4.589 | |||
| Manufacturer biggest % increase | AvtoVAZ (Lada) | 59,2% | Manufacturer biggest % lost | Honda | -17,1% | |
| Mahindra & Mahindra | 52,9% | DRB-Hicom (Proton / Lotus) | -16,7% | |||
| Mitsubishi Motors | 30,6% | Toyota Motor | -9,2% | |||
| Brand biggest volume increase | Nissan | 5.566 | Brand biggest volume lost | Toyota | -3.906 | |
| Jeep | 4.368 | Audi | -3.889 | |||
| Mini | 4.201 | DS | -3.175 | |||
| Brand biggest % increase | Lamborghini | 142,9% | Brand biggest % lost | Chevrolet | -92,5% | |
| Jeep | 139,5% | Great Wall | -78,9% | |||
| Mahindra | 107,7% | Tata | -57,1% |
Jan – May 2015 sales
Year-to-date, Renault-Nissan improves its position as the biggest gaining manufacturer ahead of Volkswagen Group, while Daimler consolidates its third place of biggest winners thanks to gains at both Mercedes-Benz and Smart.
 In the brand ranking, Mercedes-Benz leapfrogs BMW to become second-ranked premium brand behind Audi and #7 overall, while Mini passes Suzuki to enter the brand top-20. Surging Mitsubishi edges ahead of struggling Honda for the first time since at least the year 2000. Within the next few months, Porsche could move ahead of DS in the brands ranking, with the German sports car brand riding a wave of success on its best-selling Macan SUV, and DS struggling to sell its ageing hatchbacks.
Jan – May winners and losers
| Manufacturer biggest volume increase | Renault-Nissan | 92.550 | Manufacturer biggest volume lost | General Motors | -14.627 | |
| Volkswagen Group | 76.357 | Honda | -6.111 | |||
| Daimler AG | 41.537 | Aston Martin | -22 | |||
| Manufacturer biggest % increase | DRB-Hicom (Proton / Lotus) | 61,8% | Manufacturer biggest % lost | Honda | -10,0% | |
| Mitsubishi Motors | 51,7% | General Motors | -3,6% | |||
| Mahindra & Mahindra | 48,1% | Aston Martin | -3,0% | |||
| Brand biggest volume increase | Volkswagen | 44.716 | Brand biggest volume lost | Chevrolet | -31.079 | |
| Renault | 42.834 | DS | -8.649 | |||
| Nissan | 41.985 | Honda | -6.111 | |||
| Brand biggest % increase | Jeep | 181,4% | Brand biggest % lost | Chevrolet | -96,6% | |
| Lamborghini | 118,5% | Great Wall | -77,6% | |||
| Mahindra | 81,2% | Tata | -52,3% |
May 2015 brand ranking
| Brand | May 2015 | May 2014 | change | |
| 1 | Volkswagen | 142.616 | 144.108 | -1,0% |
| 2 | Ford | 82.412 | 83.461 | -1,3% |
| 3 | Opel-Vauxhall | 77.309 | 79.303 | -2,5% |
| 4 | Renault | 75.146 | 71.006 | 5,8% |
| 5 | Peugeot | 67.381 | 68.463 | -1,6% |
| 6 | Audi | 62.449 | 66.338 | -5,9% |
| 7 | Mercedes-Benz | 61.213 | 57.946 | 5,6% |
| 8 | Fiat | 57.601 | 54.338 | 6,0% |
| 9 | BMW | 56.977 | 55.286 | 3,1% |
| 10 | Skoda | 51.502 | 51.482 | 0,0% |
| 11 | Nissan | 43.648 | 38.082 | 14,6% |
| 12 | Citroën | 43.236 | 45.973 | -6,0% |
| 13 | Toyota | 41.219 | 45.125 | -8,7% |
| 14 | Hyundai | 36.506 | 34.938 | 4,5% |
| 15 | Seat | 31.302 | 31.752 | -1,4% |
| 16 | Kia | 31.023 | 29.602 | 4,8% |
| 17 | Dacia | 30.609 | 30.501 | 0,4% |
| 18 | Volvo | 21.605 | 21.979 | -1,7% |
| 19 | Mini | 15.446 | 11.245 | 37,4% |
| 20 | Mazda | 14.205 | 14.194 | 0,1% |
| 21 | Suzuki | 13.928 | 12.209 | 14,1% |
| 22 | Land Rover | 12.329 | 10.442 | 18,1% |
| 23 | Mitsubishi | 11.215 | 8.590 | 30,6% |
| 24 | Smart | 9.254 | 5.082 | 82,1% |
| 25 | Honda | 9.230 | 11.129 | -17,1% |
| 26 | Jeep | 7.499 | 3.131 | 139,5% |
| 27 | Porsche | 6.293 | 5.570 | 13,0% |
| 28 | Lancia-Chrysler | 5.670 | 7.490 | -24,3% |
| 29 | Alfa Romeo | 5.512 | 5.542 | -0,5% |
| 30 | DS | 5.013 | 8.188 | -38,8% |
| 31 | Subaru | 3.165 | 2.797 | 13,2% |
| 32 | Jaguar | 2.576 | 2.358 | 9,2% |
| 33 | Lexus | 1.756 | 2.220 | -20,9% |
| 34 | SSangYong | 1.059 | 702 | 50,9% |
| 35 | Tesla | 970 | 778 | 24,7% |
| 36 | Maserati | 562 | 539 | 4,3% |
| 37 | Infiniti | 488 | 429 | 13,8% |
| 38 | Ferrari | 284 | 243 | 16,9% |
| 39 | SAIC MG | 270 | 241 | 12,0% |
| 40 | Chevrolet | 210 | 2.789 | -92,5% |
| 41 | Bentley | 166 | 198 | -16,2% |
| 42 | Lada | 164 | 103 | 59,2% |
| 43 | Aston Martin | 137 | 142 | -3,5% |
| 44 | Lamborghini | 85 | 35 | 142,9% |
| 45 | Rolls Royce | 64 | 67 | -4,5% |
| 46 | Lotus | 55 | 66 | -16,7% |
| 47 | Mahindra | 54 | 26 | 107,7% |
| 48 | Chevrolet USA | 49 | 70 | -30,0% |
| 49 | Dodge | 42 | 83 | -49,4% |
| 50 | Cadillac | 40 | 29 | 37,9% |
| 51 | Tata | 18 | 42 | -57,1% |
| 52 | DR | 14 | 21 | -33,3% |
| 53 | Great Wall | 8 | 38 | -78,9% |
| 54 | Daihatsu | 7 | 2 | 250,0% |
| 55 | Bugatti | 1 | 0 | – |
Jan – May 2015 brand ranking
| Brand | Jan-May 2015 | Jan-May 2014 | change | |
| 1 | Volkswagen | 729.894 | 685.178 | 6,5% |
| 2 | Ford | 441.636 | 423.109 | 4,4% |
| 3 | Renault | 404.266 | 361.432 | 11,9% |
| 4 | Opel/Vauxhall | 394.161 | 377.294 | 4,5% |
| 5 | Peugeot | 362.211 | 346.149 | 4,6% |
| 6 | Audi | 323.779 | 320.216 | 1,1% |
| 7 | Mercedes-Benz | 300.691 | 273.822 | 9,8% |
| 8 | BMW | 299.272 | 280.814 | 6,6% |
| 9 | Fiat | 286.580 | 265.157 | 8,1% |
| 10 | Skoda | 255.966 | 246.308 | 3,9% |
| 11 | Nissan | 248.472 | 206.487 | 20,3% |
| 12 | Toyota | 238.822 | 233.819 | 2,1% |
| 13 | Citroën | 233.494 | 232.350 | 0,5% |
| 14 | Hyundai | 193.159 | 177.554 | 8,8% |
| 15 | Kia | 164.010 | 152.456 | 7,6% |
| 16 | Dacia | 163.036 | 156.132 | 4,4% |
| 17 | Seat | 149.526 | 138.672 | 7,8% |
| 18 | Volvo | 108.023 | 102.377 | 5,5% |
| 19 | Mazda | 80.534 | 76.854 | 4,8% |
| 20 | Mini | 74.578 | 55.258 | 35,0% |
| 21 | Suzuki | 73.963 | 72.782 | 1,6% |
| 22 | Land Rover | 63.686 | 56.507 | 12,7% |
| 23 | Mitsubishi | 56.951 | 37.532 | 51,7% |
| 24 | Honda | 55.177 | 61.288 | -10,0% |
| 25 | Smart | 41.518 | 26.849 | 54,6% |
| 26 | Jeep | 35.956 | 12.777 | 181,4% |
| 27 | DS | 32.071 | 40.720 | -21,2% |
| 28 | Porsche | 30.202 | 22.721 | 32,9% |
| 29 | Lancia-Chrysler | 29.596 | 33.873 | -12,6% |
| 30 | Alfa Romeo | 25.519 | 26.919 | -5,2% |
| 31 | Subaru | 15.774 | 15.597 | 1,1% |
| 32 | Lexus | 13.519 | 11.808 | 14,5% |
| 33 | Jaguar | 12.026 | 13.058 | -7,9% |
| 34 | Tesla | 4.991 | 4.244 | 17,6% |
| 35 | SSangYong | 4.731 | 3.225 | 46,7% |
| 36 | Maserati | 2.766 | 2.542 | 8,8% |
| 37 | Infiniti | 2.308 | 1.481 | 55,8% |
| 38 | SAIC MG | 1.438 | 1.008 | 42,7% |
| 39 | Ferrari | 1.273 | 1.225 | 3,9% |
| 40 | Chevrolet | 1.080 | 32.159 | -96,6% |
| 41 | Bentley | 1.007 | 1.133 | -11,1% |
| 42 | Lada | 803 | 601 | 33,6% |
| 43 | Aston Martin | 722 | 744 | -3,0% |
| 44 | Lamborghini | 402 | 184 | 118,5% |
| 45 | Lotus | 351 | 216 | 62,5% |
| 46 | Rolls Royce | 263 | 310 | -15,2% |
| 47 | Mahindra | 241 | 133 | 81,2% |
| 48 | Dodge | 196 | 282 | -30,5% |
| 49 | Cadillac | 194 | 171 | 13,5% |
| 50 | Chevrolet USA | 150 | 575 | -73,9% |
| 51 | DR | 132 | 100 | 32,0% |
| 52 | Tata | 106 | 222 | -52,3% |
| 53 | Great Wall | 43 | 192 | -77,6% |
| 54 | Daihatsu | 7 | 7 | 0,0% |
| 55 | Bugatti | 3 | 3 | 0,0% |