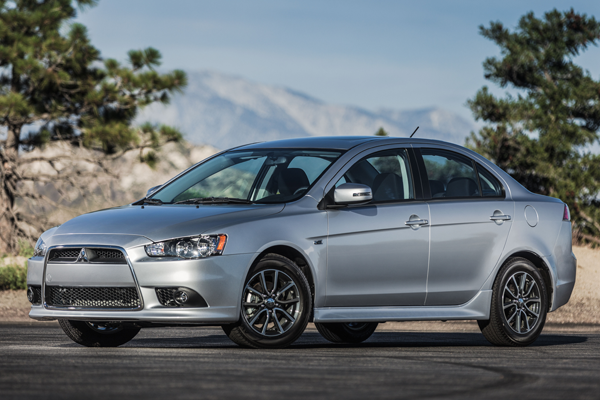
 Monthly and annual sales figures for the Mitsubishi Lancer in the US.
See how Mitsubishi Lancer sales compare to the other models in the US Compact Car segment. Also find Mitsubishi Lancer sales figures in Europe and Mitsubishi Lancer EX sales figures in China.
MitsubishiLancer2016 |
MitsubishiLancer2017 |
MitsubishiLancer2018 |
|
| January | 1.523 | 1.468 | 678 |
| February | 1.997 | 2.225 | 611 |
| March | 1.934 | 1.528 | 773 |
| April | 1.023 | 832 | 441 |
| May | 929 | 896 | 380 |
| June | 1.028 | 868 | 416 |
| July | 1.093 | 1.025 | 3 |
| August | 1.089 | 979 | |
| September | 923 | 812 | |
| October | 1.021 | 679 | |
| November | 884 | 730 | |
| December | 860 | 683 |
MitsubishiLancer |
|
| 2018 | 3.302 |
| 2017 | 12.725 |
| 2016 | 14.304 |
| 2015 | 17.691 |
| 2014 | 16.495 |
| 2013 | 19.451 |
| 2012 | 16.426 |
| 2011 | 19.874 |
| 2010 | 21.416 |
| 2009 | 20.117 |
| 2008 | 27.861 |
| 2007 | 31.376 |
| 2006 | 23.167 |
| 2005 | 27.849 |
| 2004 | 41.706 |
| 2003 | 48.159 |
| 2002 | 69.007 |
| 2001 | 25.084 |
| 2000 | 0 |
Use the dropdown at the top right of this page to find sales figures for any other car model sold in the US since the early 2000’s.
Sources: Manufacturers, ANDC
MitsubishiLancer2016 |
MitsubishiLancer2017 |
MitsubishiLancer2018 |
|
| January | 1.523 | 1.468 | 678 |
| February | 1.997 | 2.225 | 611 |
| March | 1.934 | 1.528 | 773 |
| April | 1.023 | 832 | 441 |
| May | 929 | 896 | 380 |
| June | 1.028 | 868 | 416 |
| July | 1.093 | 1.025 | 3 |
| August | 1.089 | 979 | |
| September | 923 | 812 | |
| October | 1.021 | 679 | |
| November | 884 | 730 | |
| December | 860 | 683 |
MitsubishiLancer |
|
| 2018 | 3.302 |
| 2017 | 12.725 |
| 2016 | 14.304 |
| 2015 | 17.691 |
| 2014 | 16.495 |
| 2013 | 19.451 |
| 2012 | 16.426 |
| 2011 | 19.874 |
| 2010 | 21.416 |
| 2009 | 20.117 |
| 2008 | 27.861 |
| 2007 | 31.376 |
| 2006 | 23.167 |
| 2005 | 27.849 |
| 2004 | 41.706 |
| 2003 | 48.159 |
| 2002 | 69.007 |
| 2001 | 25.084 |
| 2000 | 0 |
