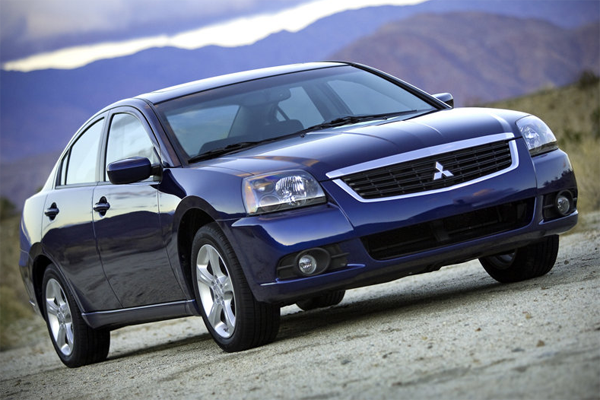
 Annual sales figures for the Mitsubishi Galant in the US.
MitsubishiGalant |
|
| 2014 | 122 |
| 2013 | 1.441 |
| 2012 | 13.261 |
| 2011 | 15.631 |
| 2010 | 11.492 |
| 2009 | 11.740 |
| 2008 | 26.941 |
| 2007 | 26.491 |
| 2006 | 27.673 |
| 2005 | 33.976 |
| 2004 | 43.491 |
| 2003 | 65.141 |
| 2002 | 97.343 |
| 2001 | 93.878 |
| 2000 | 96.452 |
| 1999 | 74.782 |
| 1998 | 44.202 |
| 1997 | 42.607 |
| 1996 | 68.866 |
| 1995 | 55.284 |
| 1994 | 65.665 |
| 1993 | 26.400 |
| 1992 | 23.758 |
| 1991 | 38.742 |
| 1990 | 40.991 |
| 1989 | 30.511 |
| 1988 | 13.621 |
| 1987 | 0 |
Use the dropdown at the top right of this page to find sales figures for any other car model sold in the US since the early 2000’s.
Sources: Manufacturers, ANDC. 1994 data sourced from Ward’s Auto Year Book by Gerard Wilson.
MitsubishiGalant |
|
| 2014 | 122 |
| 2013 | 1.441 |
| 2012 | 13.261 |
| 2011 | 15.631 |
| 2010 | 11.492 |
| 2009 | 11.740 |
| 2008 | 26.941 |
| 2007 | 26.491 |
| 2006 | 27.673 |
| 2005 | 33.976 |
| 2004 | 43.491 |
| 2003 | 65.141 |
| 2002 | 97.343 |
| 2001 | 93.878 |
| 2000 | 96.452 |
| 1999 | 74.782 |
| 1998 | 44.202 |
| 1997 | 42.607 |
| 1996 | 68.866 |
| 1995 | 55.284 |
| 1994 | 65.665 |
| 1993 | 26.400 |
| 1992 | 23.758 |
| 1991 | 38.742 |
| 1990 | 40.991 |
| 1989 | 30.511 |
| 1988 | 13.621 |
| 1987 | 0 |
