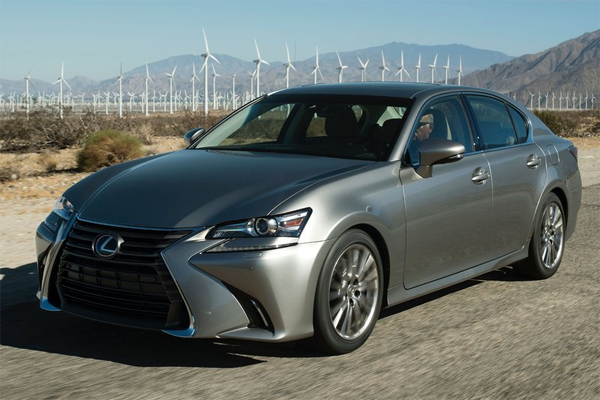
 Monthly and annual sales figures for the Lexus GS in the US.
See how Lexus GS sales compare to the other models in the US premium large car segment. Also find Lexus GS sales figures in Europe.
LexusGS2016 |
LexusGS2017 |
LexusGS2018 |
LexusGS2019 |
LexusGS2020 |
LexusGS2021 |
LexusGS2022 |
|
| January | 1.298 | 422 | 475 | 298 | 227 | 31 | |
| February | 1.167 | 536 | 534 | 263 | 224 | 14 | |
| March | 1.524 | 737 | 754 | 394 | 173 | 7 | |
| April | 1.001 | 597 | 651 | 301 | 127 | 12 | 1 |
| May | 1.111 | 615 | 672 | 260 | 266 | 5 | |
| June | 1.351 | 646 | 602 | 214 | 286 | 1 | 1 |
| July | 1.218 | 652 | 470 | 305 | 269 | 5 | |
| August | 1.228 | 689 | 549 | 342 | 330 | ||
| September | 1.066 | 666 | 451 | 193 | 262 | ||
| October | 1.388 | 558 | 387 | 222 | 200 | ||
| November | 1.201 | 739 | 472 | 321 | 111 | ||
| December | 1.325 | 916 | 587 | 265 | 85 | 1 |
LexusGS |
|
| 2021 | 76 |
| 2020 | 2.560 |
| 2019 | 3.378 |
| 2018 | 6.604 |
| 2017 | 7.773 |
| 2016 | 14.878 |
| 2015 | 23.117 |
| 2014 | 22.198 |
| 2013 | 19.742 |
| 2012 | 22.159 |
| 2011 | 3.746 |
| 2010 | 7.059 |
| 2009 | 7.430 |
| 2008 | 15.759 |
| 2007 | 23.381 |
| 2006 | 27.390 |
| 2005 | 33.457 |
| 2004 | 8.262 |
| 2003 | 13.306 |
| 2002 | 17.246 |
| 2001 | 24.461 |
| 2000 | 26.706 |
| 1999 | 31.884 |
| 1998 | 30.622 |
| 1997 | 7.718 |
| 1996 | 2.044 |
| 1995 | 6.263 |
| 1994 | 13.939 |
| 1993 | 19.164 |
| 1992 | 0 |
Use the dropdown at the top right of this page to find sales figures for any other car model sold in the US since the early 2000’s.
Sources: Manufacturers, ANDC
LexusGS2016 |
LexusGS2017 |
LexusGS2018 |
LexusGS2019 |
LexusGS2020 |
LexusGS2021 |
LexusGS2022 |
|
| January | 1.298 | 422 | 475 | 298 | 227 | 31 | |
| February | 1.167 | 536 | 534 | 263 | 224 | 14 | |
| March | 1.524 | 737 | 754 | 394 | 173 | 7 | |
| April | 1.001 | 597 | 651 | 301 | 127 | 12 | 1 |
| May | 1.111 | 615 | 672 | 260 | 266 | 5 | |
| June | 1.351 | 646 | 602 | 214 | 286 | 1 | 1 |
| July | 1.218 | 652 | 470 | 305 | 269 | 5 | |
| August | 1.228 | 689 | 549 | 342 | 330 | ||
| September | 1.066 | 666 | 451 | 193 | 262 | ||
| October | 1.388 | 558 | 387 | 222 | 200 | ||
| November | 1.201 | 739 | 472 | 321 | 111 | ||
| December | 1.325 | 916 | 587 | 265 | 85 | 1 |
LexusGS |
|
| 2021 | 76 |
| 2020 | 2.560 |
| 2019 | 3.378 |
| 2018 | 6.604 |
| 2017 | 7.773 |
| 2016 | 14.878 |
| 2015 | 23.117 |
| 2014 | 22.198 |
| 2013 | 19.742 |
| 2012 | 22.159 |
| 2011 | 3.746 |
| 2010 | 7.059 |
| 2009 | 7.430 |
| 2008 | 15.759 |
| 2007 | 23.381 |
| 2006 | 27.390 |
| 2005 | 33.457 |
| 2004 | 8.262 |
| 2003 | 13.306 |
| 2002 | 17.246 |
| 2001 | 24.461 |
| 2000 | 26.706 |
| 1999 | 31.884 |
| 1998 | 30.622 |
| 1997 | 7.718 |
| 1996 | 2.044 |
| 1995 | 6.263 |
| 1994 | 13.939 |
| 1993 | 19.164 |
| 1992 | 0 |
