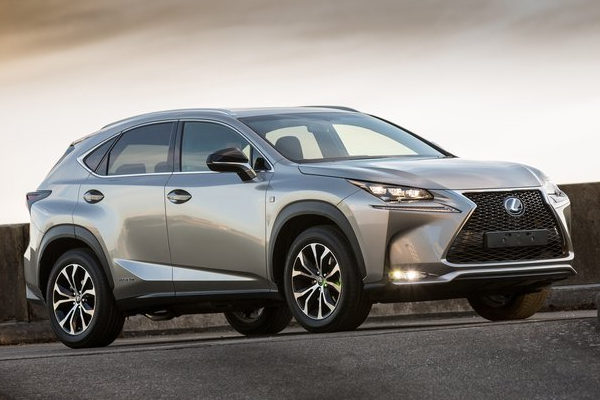
 Monthly and annual sales figures for the Lexus NX in the US.
See how Lexus NX sales compare to the other models in the US Premium mid-sized SUV segment. Also find Lexus NX sales figures in Europe.
LexusNX2016 |
LexusNX2017 |
LexusNX2018 |
LexusNX2019 |
LexusNX2020 |
LexusNX2021 |
LexusNX2022 |
|
| January | 3.133 | 2.964 | 4.205 | 3.982 | 3.826 | 3.844 | 3.194 |
| February | 3.709 | 3.514 | 4.263 | 4.160 | 4.308 | 4.152 | 2.856 |
| March | 4.533 | 5.619 | 5.859 | 5.633 | 3.175 | 6.466 | 4.059 |
| April | 3.815 | 4.320 | 4.508 | 4.241 | 2.067 | 5.404 | 2.750 |
| May | 4.031 | 5.009 | 4.975 | 4.612 | 4.707 | 6.453 | 3.019 |
| June | 4.069 | 4.597 | 4.862 | 4.248 | 4.642 | 5.747 | 3.737 |
| July | 4.689 | 5.406 | 4.653 | 4.423 | 4.726 | 6.827 | 4.433 |
| August | 5.407 | 5.517 | 5.644 | 5.138 | 4.784 | 6.878 | 3.883 |
| September | 4.729 | 5.041 | 4.544 | 3.637 | 3.694 | 4.773 | 3.720 |
| October | 4.274 | 4.540 | 4.180 | 4.266 | 5.470 | 4.133 | 5.557 |
| November | 5.120 | 5.404 | 5.622 | 6.420 | 6.129 | 2.321 | 5.706 |
| December | 7.375 | 7.410 | 8.764 | 7.955 | 8.256 | 1.516 |
LexusNX |
|
| 2021 | 58.514 |
| 2020 | 55.784 |
| 2019 | 58.715 |
| 2018 | 62.079 |
| 2017 | 59.341 |
| 2016 | 54.884 |
| 2015 | 43.764 |
| 2014 | 2.927 |
Use the dropdown at the top right of this page to find sales figures for any other car model sold in the US since the early 2000’s.
Sources: Manufacturers, ANDC
LexusNX2016 |
LexusNX2017 |
LexusNX2018 |
LexusNX2019 |
LexusNX2020 |
LexusNX2021 |
LexusNX2022 |
|
| January | 3.133 | 2.964 | 4.205 | 3.982 | 3.826 | 3.844 | 3.194 |
| February | 3.709 | 3.514 | 4.263 | 4.160 | 4.308 | 4.152 | 2.856 |
| March | 4.533 | 5.619 | 5.859 | 5.633 | 3.175 | 6.466 | 4.059 |
| April | 3.815 | 4.320 | 4.508 | 4.241 | 2.067 | 5.404 | 2.750 |
| May | 4.031 | 5.009 | 4.975 | 4.612 | 4.707 | 6.453 | 3.019 |
| June | 4.069 | 4.597 | 4.862 | 4.248 | 4.642 | 5.747 | 3.737 |
| July | 4.689 | 5.406 | 4.653 | 4.423 | 4.726 | 6.827 | 4.433 |
| August | 5.407 | 5.517 | 5.644 | 5.138 | 4.784 | 6.878 | 3.883 |
| September | 4.729 | 5.041 | 4.544 | 3.637 | 3.694 | 4.773 | 3.720 |
| October | 4.274 | 4.540 | 4.180 | 4.266 | 5.470 | 4.133 | 5.557 |
| November | 5.120 | 5.404 | 5.622 | 6.420 | 6.129 | 2.321 | 5.706 |
| December | 7.375 | 7.410 | 8.764 | 7.955 | 8.256 | 1.516 |
LexusNX |
|
| 2021 | 58.514 |
| 2020 | 55.784 |
| 2019 | 58.715 |
| 2018 | 62.079 |
| 2017 | 59.341 |
| 2016 | 54.884 |
| 2015 | 43.764 |
| 2014 | 2.927 |
