
 It’s taken a while, but we can now present you the European LCV sales top-10 for 2014, following up on the 2009-2013 LCV ranking published last year. Light Commercial Vehicle sales increased 13,2% in 2014 to 1,55 million, the highest figure in the past 6 years, as a result of pent-up demand from an aging fleet as a result of postponed replacement during the crisis years. The market has slightly fragmented as the share of the top-10 brands has shrunk from 89,4% in 2013 to 88,6% in 2014.
Also read our article about the changing alliances in the European LCV market.
 Most LCV sales are from small, medium and large cargo vans, as pick-up trucks are much less popular in Europe than they are in the rest of the world. In France and to a lesser extent in the UK, commercial versions of passenger cars are also commonplace, but these cars are still a fraction of total light commercial vehicle sales in Europe.
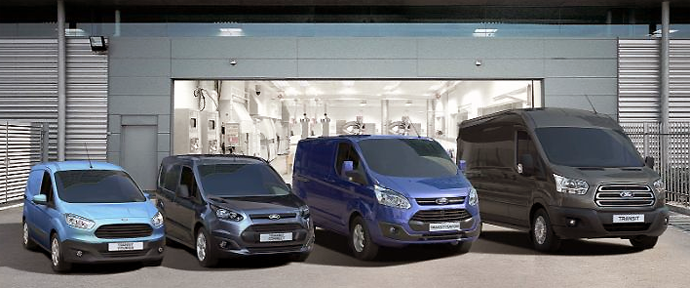
Despite a gain of 9,6% and adding almost 20.000 units to its European sales, Renault has lost half a percentage point of its market share, as both Volkswagen and especially Ford improved even further. Ford is boosted by the complete renewal of its commercial van line-up, which now consists of 4 models, ranging from the small Transit Courier to the full-sized Transit. As a result, for the first time ever, three brands have sold more than 200.000 LCVs in Europe.
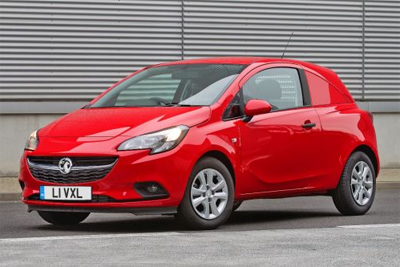
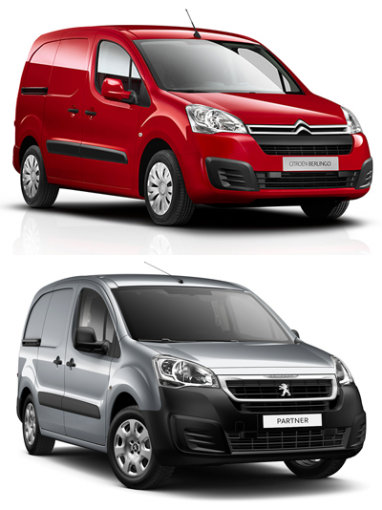 Citroën has moved past its sibling Peugeot thanks to sales up 10,5% vs. 7,5%, even though the two brands offer the exact same line-up of vans in four different sizes, with the different brands only slight differentiated in the design of the front fascia and grille, and of course the badge. PSA’s partner in medium and large vans Fiat is closing in on the top-5 with sales up 13,7%. Mercedes-Benz hasn’t yet benefited from the new generation Vito in 2014, but is likely to get a boost from that model introduction in 2015, and should be able to reach a 10% market share as a result. Opel has moved past Nissan for the #8 spot, and that’s without its UK co-brand Vauxhall, which is in 12th place, selling almost as many LCVs just in the UK as Toyota sold in all of Europe. Nissan hasn’t received a replacement to the Primastar, a clone of the Renault Trafic and Opel/Vauxhall Vivaro, as the NV200 sits right in between the “Kangoo-segment” and the “Trafic-segment” sizewise.
| Brand | Sales | Change | Market Share | |||
| 2014 | 2013 | 2014 | 2013 | |||
| 1 | Renault | 222.659 | 203.078 | 9,6% | 14,3% | 14,8% |
| 2 | VW | 204.449 | 182.230 | 12,2% | 13,2% | 13,3% |
| 3 | Ford | 202.852 | 161.218 | 25,8% | 13,1% | 11,8% |
| 4 | Citroën | 160.400 | 145.124 | 10,5% | 10,3% | 10,6% |
| 5 | Peugeot | 159.855 | 148.751 | 7,5% | 10,3% | 10,8% |
| 6 | Fiat | 152.364 | 134.034 | 13,7% | 9,8% | 9,8% |
| 7 | Mercedes-Benz | 144.011 | 130.421 | 10,4% | 9,3% | 9,5% |
| 8 | Opel | 48.117 | 41.800 | 15,1% | 3,1% | 3,0% |
| 9 | Nissan | 42.522 | 42.650 | -0,3% | 2,7% | 3,1% |
| 10 | Iveco | 39.130 | 37.005 | 5,7% | 2,5% | 2,7% |
| 11 | Toyota | 36.329 | n/a | n/a | 2,3% | |
| 12 | Vauxhall | 32.620 | 29.700 | n/a | 2,1% | 9,8% |
| Others | 107.398 | 114.987 | ||||
| Total market | 1.552.706 | 1.370.998 | 13,3% | |||
LCV model ranking
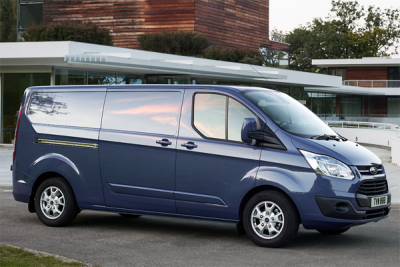 Thanks to a 25,7% improvement in sales, the Ford Transit (including the Transit Custom) extends its traditional title of best selling LCV in Europe. More than a third of its volume comes from the UK market, where Ford owns more than a quarter of the LCV market an the Transit would be a top-5 player in overall car sales, including passenger cars. The rest of the top-4 best selling vans in Europe is stable, withe Mercedes-Benz Sprinter, Volkswagen Transporter and Citroën Berlingo in that order, all growing 15% to 16% in 2014. The Fiat Ducato jumps two spots to enter the top-5 thanks to a 21% boost in sales, and that’s before its facelifted version was introduced in 2015.
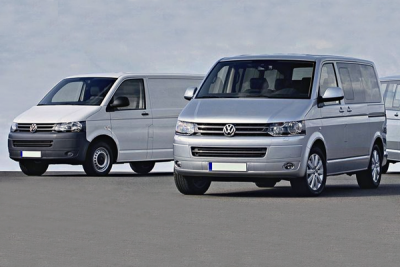
The Volkswagen Caddy is the only model in the top-10 to lose volume on 2013 and as a result it tumbles down the ranking from #6 to #9. And the Caddy, as well as the Transporter have only just been renewed at the end of 2015, so their sales figures won’t reflect the boost from the new models until 2016.
| Model | Sales | Market Share | ||||
| 2014 | 2013 | Change | 2014 | 2013 | ||
| 1 | Ford Transit | 168.802 | 134.268 | 25,7% | 10,9% | 9,8% |
| 2 | Mercedes-Benz Sprinter | 90.586 | 78.742 | 15,0% | 5,8% | 5,7% |
| 3 | VW Transporter | 81.324 | 70.134 | 16,0% | 5,2% | 5,1% |
| 4 | Citroën Berlingo | 76.634 | 66.628 | 15,0% | 4,9% | 4,9% |
| 5 | Fiat Ducato | 71.336 | 58.945 | 21,0% | 4,6% | 4,3% |
| 6 | Renault Kangoo | 69.683 | 63.429 | 9,9% | 4,5% | 4,6% |
| 7 | Peugeot Partner | 65.507 | 58.818 | 11,4% | 4,2% | 4,3% |
| 8 | Renault Master | 62.006 | 57.040 | 8,7% | 4,0% | 4,2% |
| 9 | VW Caddy | 61.339 | 61.834 | -0,8% | 4,0% | 4,5% |
| 10 | Renault Trafic | 50.846 | 43.754 | 16,2% | 3,3% | 3,2% |
| Total market | 1.552.706 | 1.370.998 | 13,3% | |||
Combined sales of cargo vans and passenger vans
 When taking into account the 2014 sales of passenger vans, we can conclude that the volume increase for cargo vans has been greater than the improvement of passenger van sales, as the share of passenger vans in total van sales has dropped from 19,7% in 2013 to 18,4% in 2014. The Ford Transit is one of the major contributors to this trend, as its share of passenger vans has dropped from 11,1% to just 6,8%. Still, 9 models out of the top-10 see their share decreased in 2014.
The Volkswagen Caddy still has the highest percentage of passenger van sales, with almost half of all Caddy’s sold in Europe equipped with rear seats and windows. As a result, it’s still in fourth place of overall van sales in Europe, down from #3 in 2013, but up from #9 in the cargo van ranking.
| Model | Sales incl. passenger vans | Passenger van % | ||||
| 2014 | 2013 | Change | 2014 | 2013 | ||
| 1 | Ford Transit | 181.094 | 150.958 | 20,0% | 6,8% | 11,1% |
| 2 | VW Transporter | 131.354 | 115.826 | 13,4% | 38,1% | 39,4% |
| 3 | Citroën Berlingo | 112.012 | 104.585 | 7,1% | 31,6% | 36,3% |
| 4 | VW Caddy | 108.729 | 110.941 | -2,0% | 43,6% | 44,3% |
| 5 | Mercedes-Benz Sprinter | 96.797 | 84.018 | 15,2% | 6,4% | 6,3% |
| 6 | Fiat Ducato | 95.539 | 79.769 | 19,8% | 25,3% | 26,1% |
| 7 | Renault Kangoo | 92.654 | 85.529 | 8,3% | 24,8% | 25,8% |
| 8 | Peugeot Partner | 89.413 | 85.019 | 5,2% | 26,7% | 30,8% |
| 9 | Renault Master | 63.935 | 58.682 | 9,0% | 3,0% | 2,8% |
| 10 | Renault Trafic | 59.230 | 53.733 | 10,2% | 14,2% | 18,6% |
| Total market | 1.901.664 | 1.707.657 | 11,4% | 18,3% | 19,7% | |