 Roewe Sales Data & Trends for the Chinese Automotive Market
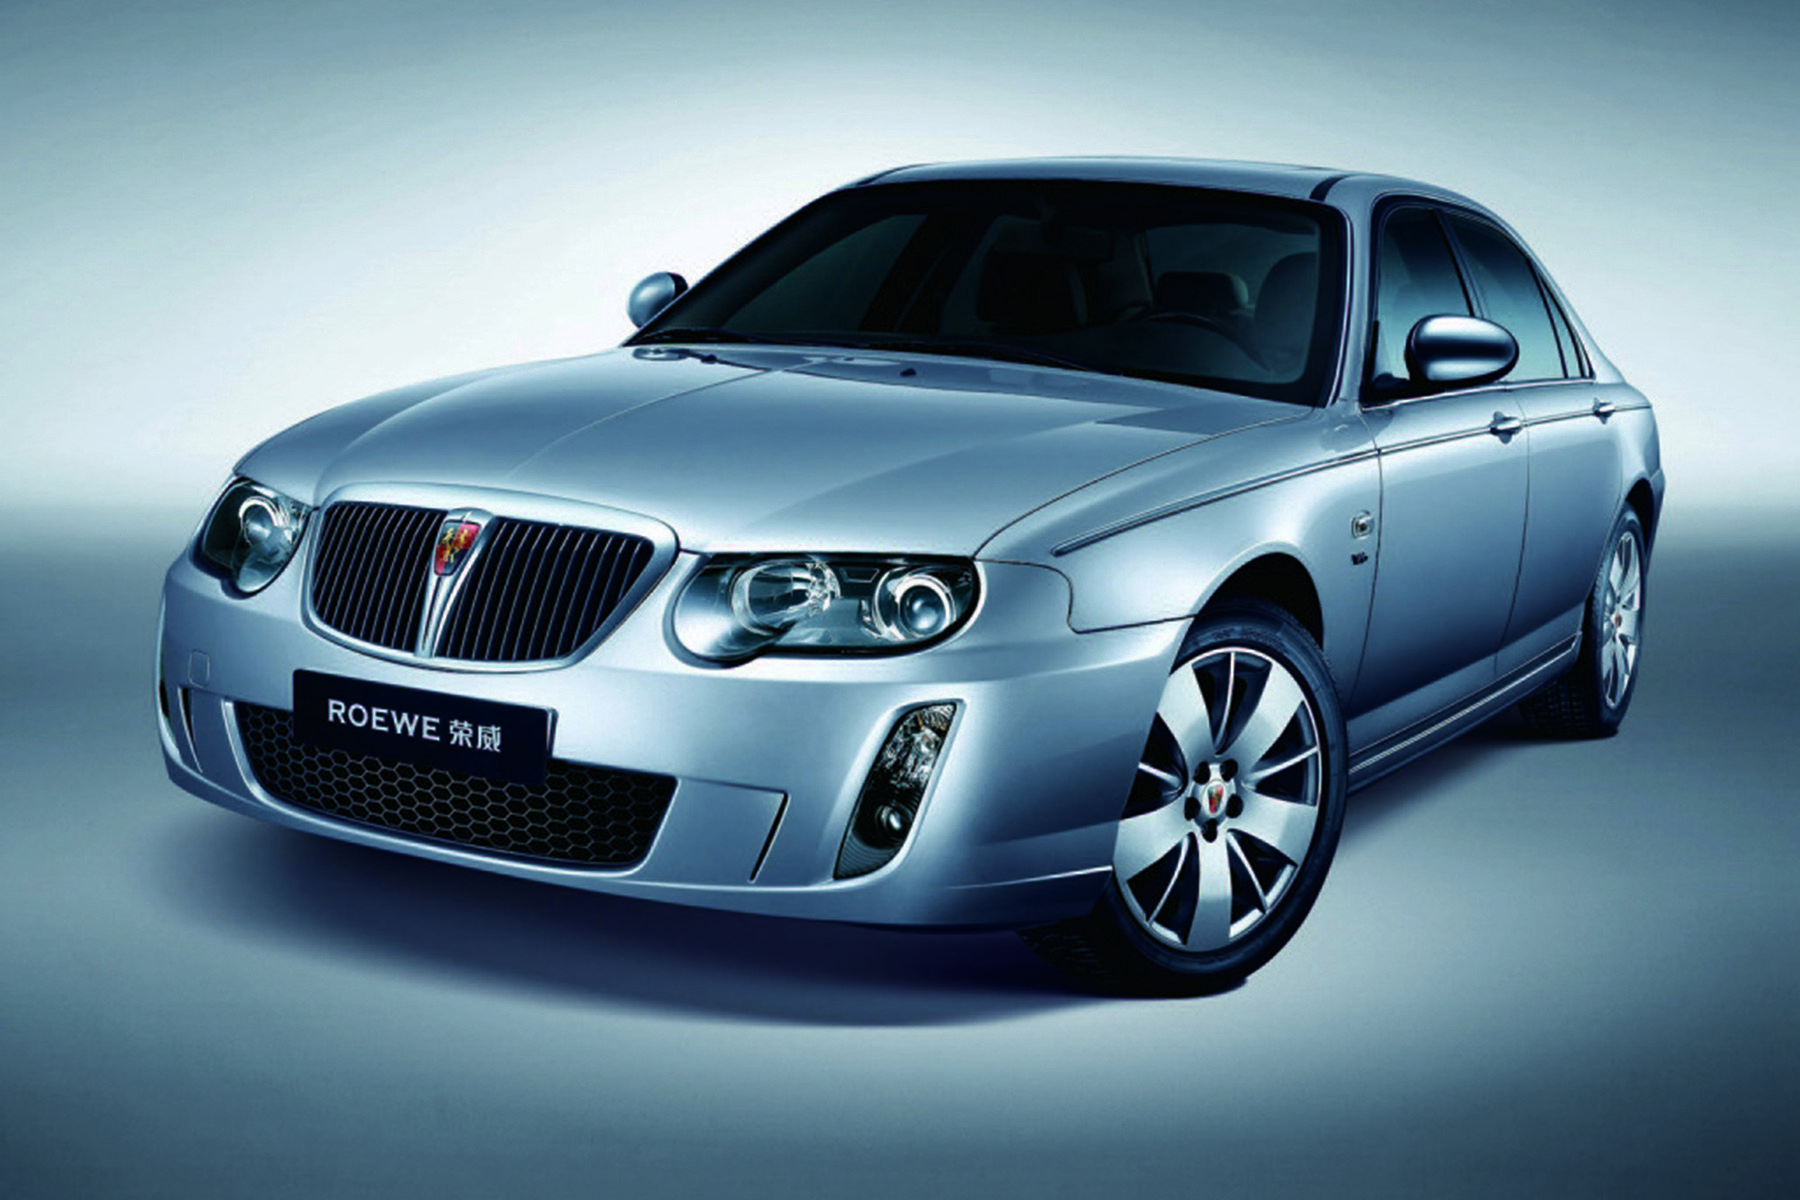
Roewe is a brand of SAIC (Shanghai Automotive Industry Corporation), which bought the technology from MG Rover when this British company went bankrupt in 2005.
However, they didn’t get the rights for the Rover brand, so decided to call the brand Roewe, which sounds similar. SAIC also produces and markets cars under the Maxus and MG brands and has manufacturing Joint Ventures with General Motors, Iveco and Volkswagen to produce cars under the Baojun, Buick, Cadillac, Chevrolet, Wuling, Iveco, Skoda and Volkswagen brands.
Sales figures for the Roewe 350, 360, i5, i6, 550, e550 PHEV, 750, 950, E950, RX3, RX5, Marvel X, RX8, E50 EV, W5.
Monthly Vehicle Sales
| Year | Jan | Feb | Mar | Apr | May | Jun | Jul | Aug | Sep | Oct | Nov | Dec |
|---|---|---|---|---|---|---|---|---|---|---|---|---|
| 2016 | 15,264 | 8,777 | 12,928 | 10,865 | 11,805 | 11,854 | 14,422 | 20,812 | 27,301 | 33,102 | 34,807 | 39,391 |
| 2017 | 31,223 | 24,036 | 35,861 | 27,753 | 28,370 | 24,752 | 28,515 | 30,502 | 38,214 | 38,238 | 39,735 | 39,424 |
| 2018 | 49,049 | 34,398 | 41,714 | 39,397 | 39,225 | 37,617 | 32,347 | 33,414 | 32,333 | 40,770 | 42,919 | 47,622 |
| 2019 | 41,336 | 27,453 | 32,843 | 36,787 | 35,332 | 29,694 | 33,071 | 30,458 | 37,843 | 37,502 | 37,940 | 45,869 |
| 2020 | 39,831 | 4,731 | 11,340 | 17,583 | 35,879 | 33,369 | 34,883 | 32,135 | 37,766 | 40,292 | 38,934 | 52,098 |
| 2021 | 34,239 | 13,665 | 27,829 | 31,226 | 29,290 | 23,554 | 23,617 | 29,416 | 37,259 | 51,276 | 32,447 | 34,898 |
| 2022 | 40,955 | 27,009 | 30,252 | 8,029 | 26,421 | 23,245 | 30,627 | 23,406 | 20,259 | 20,293 | 21,928 | |
| Avg = | Avg = | Avg = | Avg = | Avg = | Avg = | Avg = | Avg = | Avg = | Avg = | Avg = | Avg = 475,387.00 |
Annual Vehicle Sales
| Year | Sales | Growth | Market Share |
|---|---|---|---|
| 2007 | 13,772 | 0.26 | |
| 2008 | 25,063 | 81.99 | 0.46 |
| 2009 | 67,402 | 168.93 | 0.81 |
| 2010 | 131,001 | 94.36 | 1.17 |
| 2011 | 113,313 | -13.50 | 0.92 |
| 2012 | 127,807 | 12.79 | 0.97 |
| 2013 | 155,336 | 21.54 | 0.95 |
| 2014 | 127,801 | -17.73 | 0.69 |
| 2015 | 99,639 | -22.04 | 0.49 |
| 2016 | 241,328 | 142.20 | 1.02 |
| 2017 | 386,622 | 60.21 | 1.60 |
| 2018 | 479,156 | 23.93 | 2.07 |
| 2019 | 426,128 | -11.07 | 2.01 |
| 2020 | 378,841 | -11.10 | 1.93 |
| 2021 | 369,852 | -2.37 | 1.76 |
Annual Vehicle Sales Chart
Market Share Chart
Car sales statistics from China only include domestic production and exclude imported models.
Sources: Manufacturers, Chooseauto.