 Lifan Sales Data & Trends for the Chinese Automotive Market
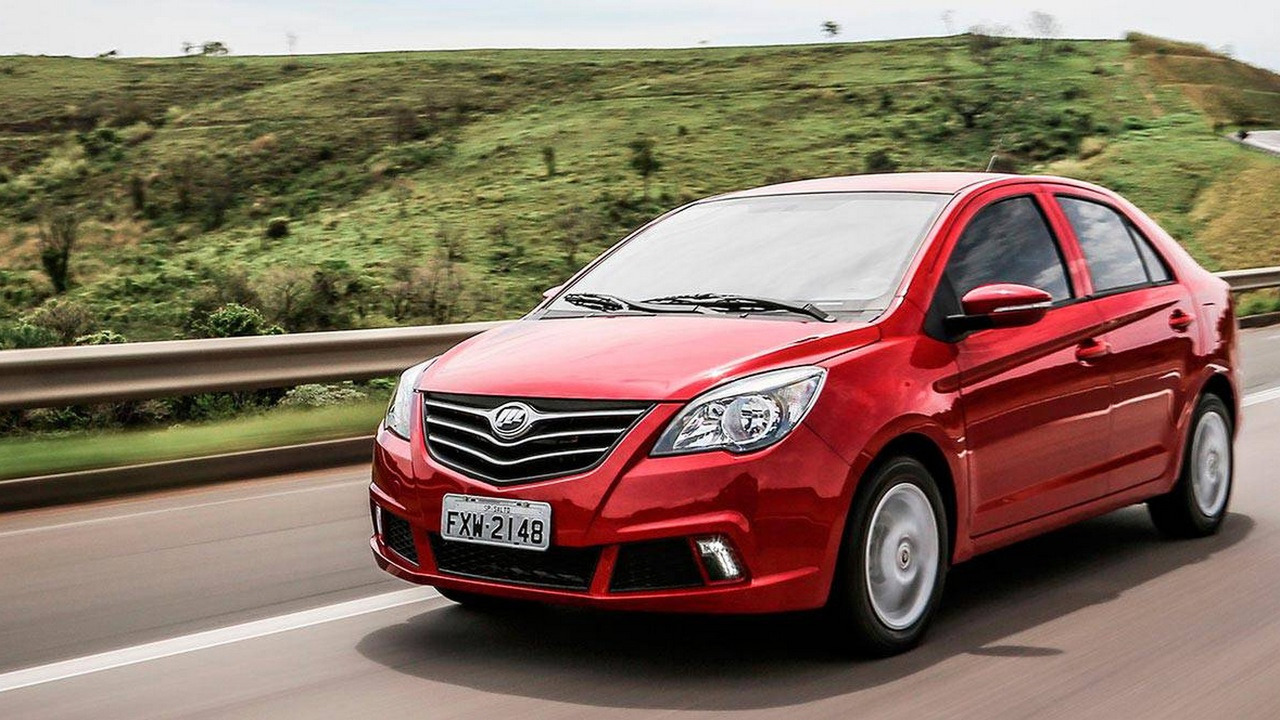
Lifan Auto, established in 1992, produces and markets cars under the Lifan brand in China since 2005.
Also find sales figures for the Lifan 330, 530, 630, 720, Xuanlang, Lotto, X50, X60, X80, Maiwei, 320, 520 / 520i, 620.
Car sales statistics from China only include domestic production and exclude imported models.
Monthly Vehicle Sales
| Year | Jan | Feb | Mar | Apr | May | Jun | Jul | Aug | Sep | Oct | Nov | Dec |
|---|---|---|---|---|---|---|---|---|---|---|---|---|
| 2016 | 3,025 | 3,617 | 3,447 | 5,286 | 6,763 | 11,974 | 9,858 | 8,373 | 8,248 | 10,935 | 14,535 | 19,598 |
| 2017 | 6,165 | 5,350 | 7,211 | 6,036 | 8,451 | 10,504 | 9,714 | 7,147 | 10,245 | 8,037 | 12,923 | 16,451 |
| 2018 | 6,761 | 4,436 | 6,374 | 5,092 | 6,183 | 5,991 | 2,860 | 2,845 | 3,397 | 3,734 | 4,077 | 6,490 |
| 2019 | 7,206 | 946 | 350 | 992 | 1,068 | 619 | 911 | 839 | 123 | 6 | 29 | 100 |
| 2020 | 50 | 0 | 191 | 59 | 0 | 31 | 45 | 0 | 12 | 60 | 174 | 7 |
| Avg = | Avg = | Avg = | Avg = | Avg = | Avg = | Avg = | Avg = | Avg = | Avg = | Avg = | Avg = 93,821.20 |
Annual Vehicle Sales
| Year | Sales | Growth | Market Share |
|---|---|---|---|
| 2006 | 2,600 | 0.06 | |
| 2007 | 38,685 | 1,387.88 | 0.73 |
| 2008 | 151,155 | 290.73 | 2.78 |
| 2009 | 42,695 | -71.75 | 0.52 |
| 2010 | 78,519 | 83.91 | 0.70 |
| 2011 | 123,966 | 57.88 | 1.01 |
| 2012 | 158,430 | 27.80 | 1.20 |
| 2013 | 153,462 | -3.14 | 0.94 |
| 2014 | 145,004 | -5.51 | 0.79 |
| 2015 | 133,140 | -8.18 | 0.66 |
| 2016 | 105,659 | -20.64 | 0.45 |
| 2017 | 108,234 | 2.44 | 0.45 |
| 2018 | 58,240 | -46.19 | 0.25 |
| 2019 | 13,189 | -77.35 | 0.06 |
| 2020 | 635 | -95.19 | 0.00 |
| 2021 | 0 | -100.00 | 0.00 |
Annual Vehicle Sales Chart
Market Share Chart
Sources: Manufacturers, Chooseauto.