 Annual sales figures for the Toyota Supra in the US.
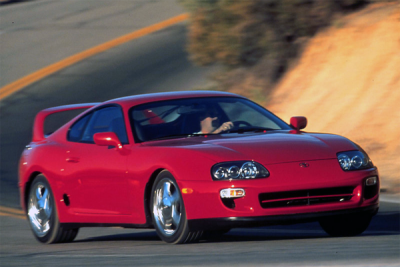
The Supra was discontinued from the US market in 1998 without a direct replacement, while production and sales in Japan continued until 2002. A new generation Supra was launched in 2019, sharing a platform with the BMW Z4.
Also find US sales figures for the Acura NSX, Mazda RX-7, Mitsubishi 3000GT and Nissan 300ZX. Also find European sales figures for the Toyota Supra.
ToyotaSupra2019 |
ToyotaSupra2020 |
ToyotaSupra2021 |
ToyotaSupra2022 |
|
| January | 342 | 394 | 370 | |
| February | 398 | 503 | 298 | |
| March | 273 | 828 | 439 | |
| April | 203 | 987 | 474 | |
| May | 499 | 1.049 | 540 | |
| June | 579 | 787 | 563 | |
| July | 320 | 515 | 537 | 538 |
| August | 643 | 500 | 304 | 413 |
| September | 514 | 489 | 436 | 220 |
| October | 516 | 677 | 294 | 486 |
| November | 487 | 708 | 228 | 353 |
| December | 404 | 704 | 483 |
ToyotaSupra |
|
| 2021 | 6.830 |
| 2020 | 5.887 |
| 2019 | 2.884 |
| 1999 | 24 |
| 1998 | 1.232 |
| 1997 | 1.379 |
| 1996 | 852 |
| 1995 | 2.266 |
| 1994 | 3.405 |
| 1993 | 2.901 |
| 1992 | 1.193 |
| 1991 | 3.623 |
| 1990 | 6.419 |
| 1989 | 14.544 |
| 1988 | 19.596 |
| 1987 | 29.907 |
| 1986 | 33.823 |
| 1985 | 23.568 |
| 1984 | 29.871 |
| 1983 | 26.972 |
| 1982 | 34.048 |
| 1981 | 16.146 |
| 1980 | 21.542 |
| 1979 | 26.207 |
Previous generation:
Use the dropdown at the top right of this page to find sales figures for any other car model sold in the US since the early 2000’s.
Sources: Manufacturers, ANDC
ToyotaSupra2019 |
ToyotaSupra2020 |
ToyotaSupra2021 |
ToyotaSupra2022 |
|
| January | 342 | 394 | 370 | |
| February | 398 | 503 | 298 | |
| March | 273 | 828 | 439 | |
| April | 203 | 987 | 474 | |
| May | 499 | 1.049 | 540 | |
| June | 579 | 787 | 563 | |
| July | 320 | 515 | 537 | 538 |
| August | 643 | 500 | 304 | 413 |
| September | 514 | 489 | 436 | 220 |
| October | 516 | 677 | 294 | 486 |
| November | 487 | 708 | 228 | 353 |
| December | 404 | 704 | 483 |
ToyotaSupra |
|
| 2021 | 6.830 |
| 2020 | 5.887 |
| 2019 | 2.884 |
| 1999 | 24 |
| 1998 | 1.232 |
| 1997 | 1.379 |
| 1996 | 852 |
| 1995 | 2.266 |
| 1994 | 3.405 |
| 1993 | 2.901 |
| 1992 | 1.193 |
| 1991 | 3.623 |
| 1990 | 6.419 |
| 1989 | 14.544 |
| 1988 | 19.596 |
| 1987 | 29.907 |
| 1986 | 33.823 |
| 1985 | 23.568 |
| 1984 | 29.871 |
| 1983 | 26.972 |
| 1982 | 34.048 |
| 1981 | 16.146 |
| 1980 | 21.542 |
| 1979 | 26.207 |