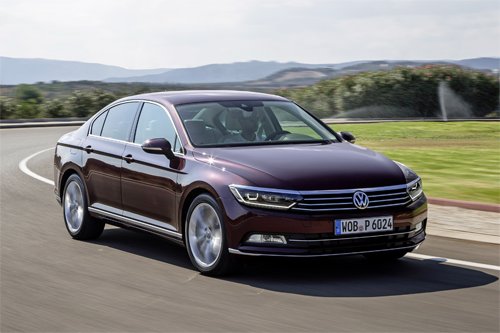
 Monthly and annual sales figures for the Volkswagen Passat in Europe.
These statistics include sales of the VW Passat sedan and station wagon only, excluding sales of the Volkswagen Passat CC.
See how Volkswagen Passat sales compare to the other models in the midsize segment. Also find Volkswagen Magotan (Euro-Passat) sales figures in China and Volkswagen Passat US sales figures.
VolkswagenPassat2016 |
VolkswagenPassat2017 |
VolkswagenPassat2018 |
VolkswagenPassat2019 |
VolkswagenPassat2020 |
VolkswagenPassat2021 |
VolkswagenPassat2022 |
|
| January | 15.498 | 16.912 | 15.278 | 9.029 | 12.619 | 9.300 | 3.994 |
| February | 16.404 | 13.086 | 12.980 | 7.147 | 10.496 | 7.521 | 4.352 |
| March | 21.364 | 15.145 | 16.239 | 12.648 | 9.081 | 10.095 | 6.620 |
| April | 19.927 | 12.835 | 14.541 | 11.922 | 4.247 | 7.965 | 6.932 |
| May | 18.618 | 20.191 | 15.350 | 12.096 | 5.850 | 8.934 | 6.928 |
| June | 19.098 | 16.940 | 18.224 | 12.209 | 7.623 | 10.208 | 6.419 |
| July | 17.024 | 14.062 | 12.699 | 11.860 | 10.864 | 6.773 | 5.862 |
| August | 11.932 | 11.786 | 14.235 | 7.192 | 8.598 | 4.643 | 4.520 |
| September | 17.174 | 16.432 | 5.497 | 6.518 | 9.521 | 3.823 | 4.617 |
| October | 16.005 | 15.697 | 8.235 | 9.768 | 10.186 | 4.215 | 5.069 |
| November | 16.326 | 15.710 | 11.918 | 12.087 | 12.099 | 4.400 | 5.855 |
| December | 17.443 | 14.492 | 8.878 | 12.174 | 14.179 | 4.611 |
VolkswagenPassat |
|
| 2021 | 82.488 |
| 2020 | 115.363 |
| 2019 | 124.650 |
| 2018 | 154.074 |
| 2017 | 183.288 |
| 2016 | 206.813 |
| 2015 | 226.127 |
| 2014 | 153.677 |
| 2013 | 156.025 |
| 2012 | 194.738 |
| 2011 | 235.143 |
| 2010 | 158.269 |
| 2009 | 177.450 |
| 2008 | 236.193 |
| 2007 | 301.645 |
| 2006 | 331.917 |
| 2005 | 272.762 |
| 2004 | 227.524 |
| 2003 | 259.362 |
| 2002 | 286.075 |
| 2001 | 332.466 |
| 2000 | 260.112 |
| 1999 | 323.415 |
| 1998 | 348.398 |
| 1997 | 275.872 |
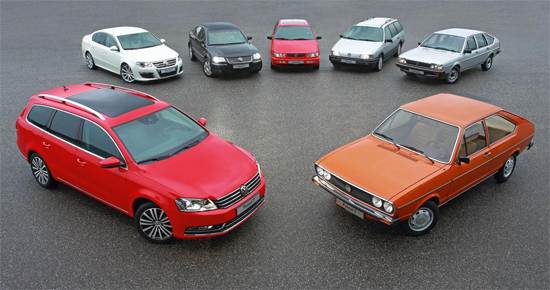
Previous generations:
- B1 “Typ 32″ (1973–1981)
- B2 “Typ 32B” (1981–1988)
- B3 “Typ 35i” (1988–1993)
- B4 “Typ 35i” (1993–1996)
- B5 “Typ 3B” (1996–2005)
- B6 “Typ 3C” (2005-2010)
- B7 “Typ 3C” (2010-2015)
Use the dropdown at the top right of this page to find sales figures for any other car model sold in Europe since the early 2000’s.
Car sales statistics are from the following countries: Austria, Belgium, Cyprus, Czech Republic, Denmark, Estonia, Finland, France, Germany, Great Britain, Greece, Hungary, Iceland, Ireland, Italy, Latvia, Lithuania, Luxembourg, Netherlands, Norway, Poland, Portugal, Romania, Slovakia, Slovenia, Spain, Sweden, Switzerland. Sources: Manufacturers, ANDC, JATO Dynamics.
VolkswagenPassat2016 |
VolkswagenPassat2017 |
VolkswagenPassat2018 |
VolkswagenPassat2019 |
VolkswagenPassat2020 |
VolkswagenPassat2021 |
VolkswagenPassat2022 |
|
| January | 15.498 | 16.912 | 15.278 | 9.029 | 12.619 | 9.300 | 3.994 |
| February | 16.404 | 13.086 | 12.980 | 7.147 | 10.496 | 7.521 | 4.352 |
| March | 21.364 | 15.145 | 16.239 | 12.648 | 9.081 | 10.095 | 6.620 |
| April | 19.927 | 12.835 | 14.541 | 11.922 | 4.247 | 7.965 | 6.932 |
| May | 18.618 | 20.191 | 15.350 | 12.096 | 5.850 | 8.934 | 6.928 |
| June | 19.098 | 16.940 | 18.224 | 12.209 | 7.623 | 10.208 | 6.419 |
| July | 17.024 | 14.062 | 12.699 | 11.860 | 10.864 | 6.773 | 5.862 |
| August | 11.932 | 11.786 | 14.235 | 7.192 | 8.598 | 4.643 | 4.520 |
| September | 17.174 | 16.432 | 5.497 | 6.518 | 9.521 | 3.823 | 4.617 |
| October | 16.005 | 15.697 | 8.235 | 9.768 | 10.186 | 4.215 | 5.069 |
| November | 16.326 | 15.710 | 11.918 | 12.087 | 12.099 | 4.400 | 5.855 |
| December | 17.443 | 14.492 | 8.878 | 12.174 | 14.179 | 4.611 |
VolkswagenPassat |
|
| 2021 | 82.488 |
| 2020 | 115.363 |
| 2019 | 124.650 |
| 2018 | 154.074 |
| 2017 | 183.288 |
| 2016 | 206.813 |
| 2015 | 226.127 |
| 2014 | 153.677 |
| 2013 | 156.025 |
| 2012 | 194.738 |
| 2011 | 235.143 |
| 2010 | 158.269 |
| 2009 | 177.450 |
| 2008 | 236.193 |
| 2007 | 301.645 |
| 2006 | 331.917 |
| 2005 | 272.762 |
| 2004 | 227.524 |
| 2003 | 259.362 |
| 2002 | 286.075 |
| 2001 | 332.466 |
| 2000 | 260.112 |
| 1999 | 323.415 |
| 1998 | 348.398 |
| 1997 | 275.872 |