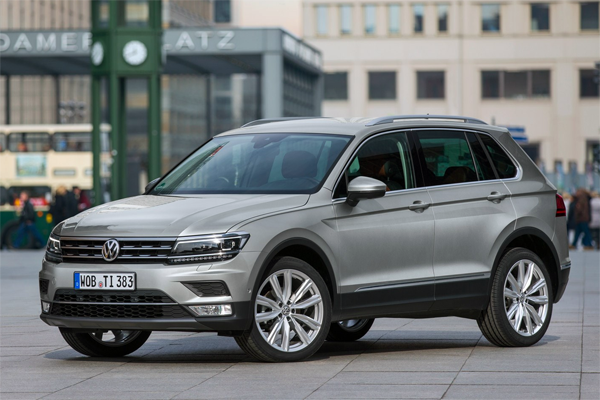
 Monthly and annual sales figures for the Volkswagen Tiguan in Europe.
Related model: Seat Ateca, Skoda Karoq, Cupra Formentor.
These figures include sales of the three-row, 7-seater Tiguan Allspace, which was launched at the end of 2017. We’ve also split Tiguan Allspace sales figures by year below the table.
See how Volkswagen Tiguan sales compare to the other models in the midsized SUV segment. Also find Volkswagen Tiguan US sales figures and Volkswagen Tiguan sales figures in China.
VolkswagenTiguan2016 |
VolkswagenTiguan2017 |
VolkswagenTiguan2018 |
VolkswagenTiguan2019 |
VolkswagenTiguan2020 |
VolkswagenTiguan2021 |
VolkswagenTiguan2022 |
|
| January | 11.138 | 21.960 | 22.841 | 19.845 | 19.493 | 13.414 | 10.665 |
| February | 10.717 | 17.335 | 18.203 | 19.139 | 16.329 | 15.292 | 10.834 |
| March | 14.956 | 26.365 | 28.114 | 27.719 | 13.962 | 24.117 | 14.539 |
| April | 11.594 | 19.780 | 22.527 | 22.472 | 5.732 | 16.672 | 6.305 |
| May | 10.095 | 21.107 | 25.041 | 22.499 | 10.298 | 16.350 | 8.236 |
| June | 13.741 | 20.007 | 28.659 | 24.223 | 18.670 | 20.814 | 12.222 |
| July | 14.344 | 15.934 | 24.660 | 25.353 | 21.397 | 15.202 | 13.770 |
| August | 13.879 | 13.810 | 24.175 | 18.605 | 12.950 | 8.406 | 11.185 |
| September | 22.110 | 22.500 | 7.741 | 19.272 | 15.960 | 9.522 | 14.378 |
| October | 18.586 | 19.341 | 16.205 | 22.025 | 13.765 | 6.605 | 14.464 |
| November | 18.759 | 20.153 | 17.438 | 23.116 | 13.405 | 6.287 | 15.762 |
| December | 18.414 | 18.031 | 15.238 | 20.494 | 14.327 | 6.394 |
VolkswagenTiguan |
|
| 2021 | 132.601 |
| 2020 | 176.288 |
| 2019 | 264.762 |
| 2018 | 250.842 |
| 2017 | 236.323 |
| 2016 | 178.333 |
| 2015 | 148.338 |
| 2014 | 150.641 |
| 2013 | 142.523 |
| 2012 | 151.517 |
| 2011 | 110.409 |
| 2010 | 104.971 |
| 2009 | 105.601 |
| 2008 | 92.638 |
| 2007 | 6.891 |
Tiguan Allspace (also included in the tables above):
| Tiguan Allspace | Sales |
| 2019 | 41.814 |
| 2018 | 34.550 |
| 2017 | 2.961 |
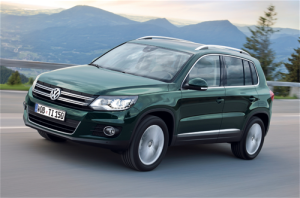
Previous model:
Use the dropdown at the top right of this page to find sales figures for any other car model sold in Europe since the early 2000’s.
Car sales statistics are from the following countries: Austria, Belgium, Cyprus, Czech Republic, Denmark, Estonia, Finland, France, Germany, Great Britain, Greece, Hungary, Iceland, Ireland, Italy, Latvia, Lithuania, Luxembourg, Netherlands, Norway, Poland, Portugal, Romania, Slovakia, Slovenia, Spain, Sweden, Switzerland. Sources: Manufacturers, ANDC, JATO Dynamics.
VolkswagenTiguan2016 |
VolkswagenTiguan2017 |
VolkswagenTiguan2018 |
VolkswagenTiguan2019 |
VolkswagenTiguan2020 |
VolkswagenTiguan2021 |
VolkswagenTiguan2022 |
|
| January | 11.138 | 21.960 | 22.841 | 19.845 | 19.493 | 13.414 | 10.665 |
| February | 10.717 | 17.335 | 18.203 | 19.139 | 16.329 | 15.292 | 10.834 |
| March | 14.956 | 26.365 | 28.114 | 27.719 | 13.962 | 24.117 | 14.539 |
| April | 11.594 | 19.780 | 22.527 | 22.472 | 5.732 | 16.672 | 6.305 |
| May | 10.095 | 21.107 | 25.041 | 22.499 | 10.298 | 16.350 | 8.236 |
| June | 13.741 | 20.007 | 28.659 | 24.223 | 18.670 | 20.814 | 12.222 |
| July | 14.344 | 15.934 | 24.660 | 25.353 | 21.397 | 15.202 | 13.770 |
| August | 13.879 | 13.810 | 24.175 | 18.605 | 12.950 | 8.406 | 11.185 |
| September | 22.110 | 22.500 | 7.741 | 19.272 | 15.960 | 9.522 | 14.378 |
| October | 18.586 | 19.341 | 16.205 | 22.025 | 13.765 | 6.605 | 14.464 |
| November | 18.759 | 20.153 | 17.438 | 23.116 | 13.405 | 6.287 | 15.762 |
| December | 18.414 | 18.031 | 15.238 | 20.494 | 14.327 | 6.394 |
VolkswagenTiguan |
|
| 2021 | 132.601 |
| 2020 | 176.288 |
| 2019 | 264.762 |
| 2018 | 250.842 |
| 2017 | 236.323 |
| 2016 | 178.333 |
| 2015 | 148.338 |
| 2014 | 150.641 |
| 2013 | 142.523 |
| 2012 | 151.517 |
| 2011 | 110.409 |
| 2010 | 104.971 |
| 2009 | 105.601 |
| 2008 | 92.638 |
| 2007 | 6.891 |