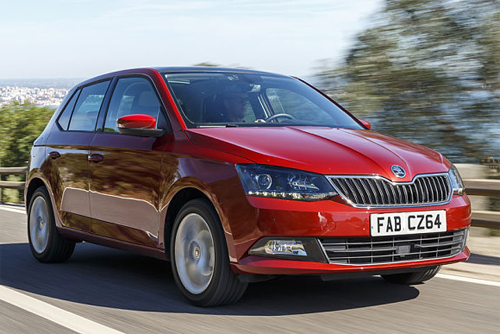
 Monthly and annual sales figures for the Skoda Fabia in Europe.
SkodaFabia2016 |
SkodaFabia2017 |
SkodaFabia2018 |
SkodaFabia2019 |
SkodaFabia2020 |
SkodaFabia2021 |
SkodaFabia2022 |
|
| January | 12.047 | 13.833 | 14.605 | 10.678 | 10.086 | 6.241 | 4.934 |
| February | 12.461 | 13.153 | 14.397 | 13.022 | 9.513 | 6.841 | 5.975 |
| March | 18.149 | 19.132 | 19.239 | 17.286 | 6.710 | 9.461 | 8.686 |
| April | 15.549 | 14.593 | 14.990 | 14.664 | 3.673 | 8.264 | 7.783 |
| May | 15.405 | 17.195 | 15.114 | 14.436 | 5.820 | 8.765 | 7.702 |
| June | 17.557 | 17.521 | 16.855 | 15.228 | 10.030 | 9.850 | 7.728 |
| July | 13.592 | 12.682 | 12.344 | 14.813 | 9.883 | 8.930 | 6.937 |
| August | 11.574 | 10.887 | 14.485 | 13.041 | 7.508 | 6.232 | 6.876 |
| September | 16.983 | 16.581 | 11.124 | 11.835 | 9.748 | 7.919 | 8.482 |
| October | 13.997 | 13.982 | 12.333 | 10.835 | 8.784 | 6.725 | 6.879 |
| November | 14.321 | 14.467 | 11.679 | 10.010 | 7.629 | 5.021 | 6.297 |
| December | 13.629 | 13.090 | 9.357 | 8.686 | 8.522 | 5.963 |
SkodaFabia |
|
| 2021 | 90.212 |
| 2020 | 97.906 |
| 2019 | 154.534 |
| 2018 | 166.522 |
| 2017 | 177.116 |
| 2016 | 175.264 |
| 2015 | 159.927 |
| 2014 | 116.337 |
| 2013 | 125.687 |
| 2012 | 140.576 |
| 2011 | 165.622 |
| 2010 | 157.000 |
| 2009 | 219.401 |
| 2008 | 201.101 |
| 2007 | 196.913 |
| 2006 | 213.493 |
| 2005 | 220.371 |
| 2004 | 235.600 |
| 2003 | 137.539 |
| 2002 | 137.930 |
| 2001 | 144.325 |
| 2000 | 75.006 |
| 1999 | 162 |
See how Skoda Fabia sales compare to the other models in the subcompact segment. Also find Skoda Fabia sales figures in China.
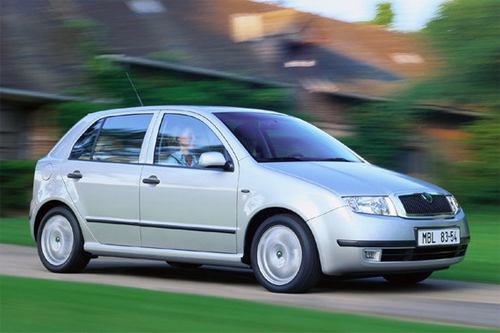
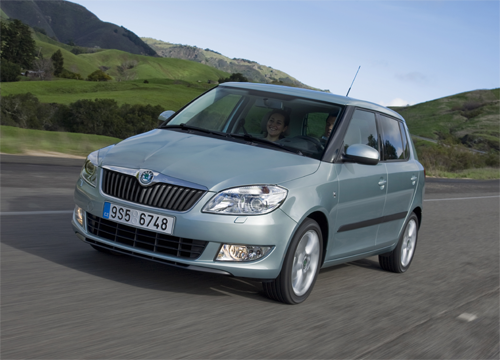
Previous generations:
1999-2007
2007-2014
Use the dropdown at the top right of this page to find sales figures for any other car model sold in Europe since the early 2000’s. Car sales statistics are from the following countries: Austria, Belgium, Cyprus, Czech Republic, Denmark, Estonia, Finland, France, Germany, Great Britain, Greece, Hungary, Iceland, Ireland, Italy, Latvia, Lithuania, Luxembourg, Netherlands, Norway, Poland, Portugal, Romania, Slovakia, Slovenia, Spain, Sweden, Switzerland. Sources: Manufacturers, ANDC, JATO Dynamics.
SkodaFabia2016 |
SkodaFabia2017 |
SkodaFabia2018 |
SkodaFabia2019 |
SkodaFabia2020 |
SkodaFabia2021 |
SkodaFabia2022 |
|
| January | 12.047 | 13.833 | 14.605 | 10.678 | 10.086 | 6.241 | 4.934 |
| February | 12.461 | 13.153 | 14.397 | 13.022 | 9.513 | 6.841 | 5.975 |
| March | 18.149 | 19.132 | 19.239 | 17.286 | 6.710 | 9.461 | 8.686 |
| April | 15.549 | 14.593 | 14.990 | 14.664 | 3.673 | 8.264 | 7.783 |
| May | 15.405 | 17.195 | 15.114 | 14.436 | 5.820 | 8.765 | 7.702 |
| June | 17.557 | 17.521 | 16.855 | 15.228 | 10.030 | 9.850 | 7.728 |
| July | 13.592 | 12.682 | 12.344 | 14.813 | 9.883 | 8.930 | 6.937 |
| August | 11.574 | 10.887 | 14.485 | 13.041 | 7.508 | 6.232 | 6.876 |
| September | 16.983 | 16.581 | 11.124 | 11.835 | 9.748 | 7.919 | 8.482 |
| October | 13.997 | 13.982 | 12.333 | 10.835 | 8.784 | 6.725 | 6.879 |
| November | 14.321 | 14.467 | 11.679 | 10.010 | 7.629 | 5.021 | 6.297 |
| December | 13.629 | 13.090 | 9.357 | 8.686 | 8.522 | 5.963 |
SkodaFabia |
|
| 2021 | 90.212 |
| 2020 | 97.906 |
| 2019 | 154.534 |
| 2018 | 166.522 |
| 2017 | 177.116 |
| 2016 | 175.264 |
| 2015 | 159.927 |
| 2014 | 116.337 |
| 2013 | 125.687 |
| 2012 | 140.576 |
| 2011 | 165.622 |
| 2010 | 157.000 |
| 2009 | 219.401 |
| 2008 | 201.101 |
| 2007 | 196.913 |
| 2006 | 213.493 |
| 2005 | 220.371 |
| 2004 | 235.600 |
| 2003 | 137.539 |
| 2002 | 137.930 |
| 2001 | 144.325 |
| 2000 | 75.006 |
| 1999 | 162 |