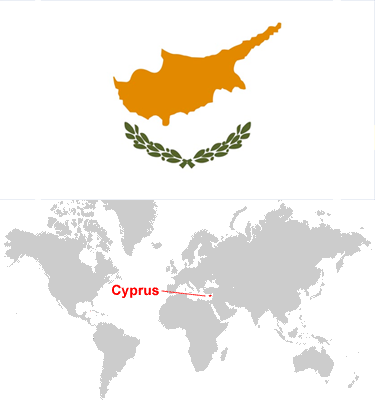
Cyprus Automotive Sales Data & Trends

Here you will find annual car sales figures for Cyprus. These statistics are Total Market Volumes, which include passenger cars as well as light commercial vehicles (LCVs).
Since the mid-2000s, the Cyprus car market has fluctuated between 8.000 and 30.000 annual sales. The market peaked in 2008 at over 29.000 sales before declining by more than a third in 2009 and further declines in the next four years. The market lost almost half of its volume in 2012 and 2013, to reach a low of just 8.000 sales, just over a quarter of its volume of five years before. From then on, car sales in Cypres showed three consecutive years of double digit increases to almost double up in three years time, but 2016 volume is still at half of its peak.
Use the drop-down menu at the top right-hand corner of this website to find passenger car sales data for (almost) any country in the world, or for specified brand and model sales data in Europe, the United States and China.
Annual Vehicle Sales
Annual Vehicle Sales Chart
Source: ACEA
EuropeCyprus |
|
| 2019 | 14.494 |
| 2018 | 15.372 |
| 2017 | 15.166 |
| 2016 | 14.520 |
| 2015 | 11.485 |
| 2014 | 9.603 |
| 2013 | 8.009 |
| 2012 | 12.260 |
| 2011 | 16.981 |
| 2010 | 18.237 |
| 2009 | 19.072 |
| 2008 | 29.106 |
| 2007 | 28.283 |
| 2006 | 23.334 |
| 2005 | 20.986 |
EuropeCyprus |
|
| 2019 | 14.494 |
| 2018 | 15.372 |
| 2017 | 15.166 |
| 2016 | 14.520 |
| 2015 | 11.485 |
| 2014 | 9.603 |
| 2013 | 8.009 |
| 2012 | 12.260 |
| 2011 | 16.981 |
| 2010 | 18.237 |
| 2009 | 19.072 |
| 2008 | 29.106 |
| 2007 | 28.283 |
| 2006 | 23.334 |
| 2005 | 20.986 |

